Every six months or so it seems as if the entire Internet discovers for the first time that people are making data visualizations of the Choose Your Own Adventure books that were popular in the early eighties. Computer scientist Christian Swinehart’s stunning visualizations are only the most recent to capture the imagination of scores of old fans, academics, and data fanatics.
Here then is a brief history of these CYOA maps:
September 2003 Andrew Stern maps a CYOA-inspired book (Night of a Thousand Boyfriends) on the group-blog Grand Text Auto. As far as I can determine, Stern’s is the ur-map, the CYOA map that started it all. Stern modestly calls his rudimentary hand-drawn map “a fun exercise,” but as the CYOA visualizations he inspired increase in complexity over time, Stern’s map is revealed to be visionary.
April 2004 Inspired directly by Stern, Matthew Kirschenbaum assigns a CYOA mapping assignment to undergraduate students in his Computer and Text course at the University of Maryland. One of Matt’s goals is to test the assumption that electronic literature is “simply a souped-up version of CYOA.”
December 2004 Greg Lord, one of Kirschenbaum’s students from the Fall 2004 section of Computer and Text, creates an interactive map of The Third Planet from Altair (CYOA #7). It is the most visually sophisticated map so far, and Lord’s analysis of the book’s various kinds of paths is especially thoughtful.
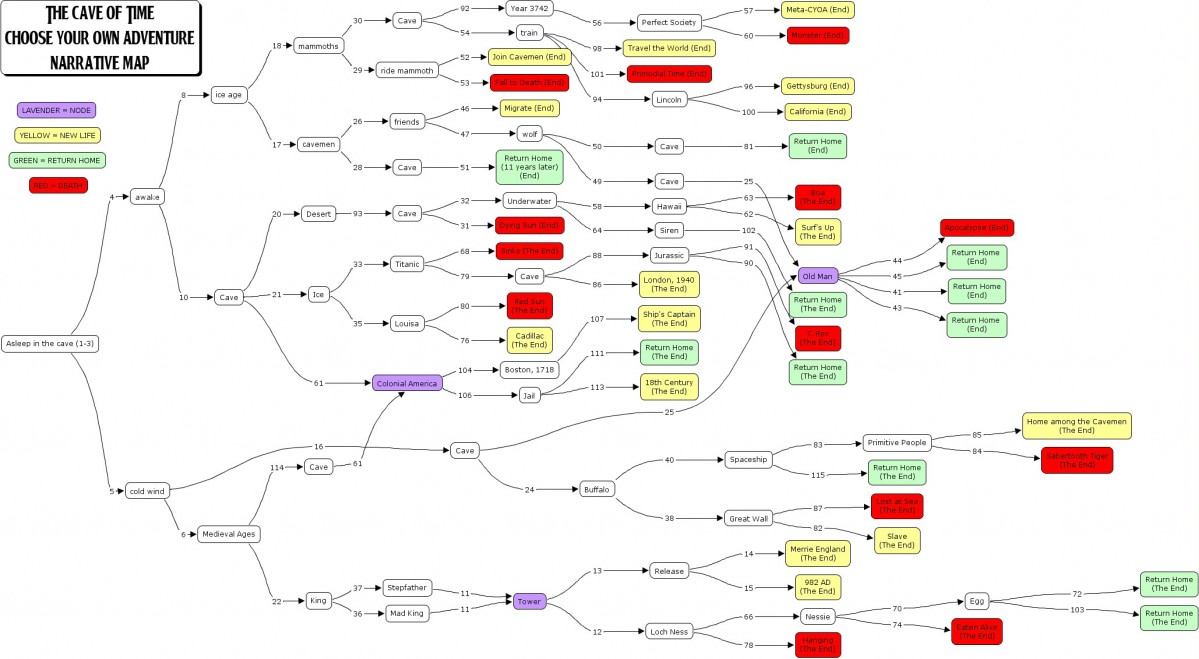
September 2005 I borrow Kirschenbaum’s assignment and revise it for a class at George Mason University on new media. As an example for my students, I map the first book in the series, The Cave of Time (CYOA #1). My own interest in the mapping of these books lies in the moral structure embedded within the novels, in which certain choices are rewarded and others are not. I’m also fascinated by the assumptions the books make about what constitutes a failed or satisfying ending.
March 2008 Sean Ragan turns The Mystery of Chimney Rock (CYOA #5) into a directed graph. Ragan uses AT&T’s open source Graphviz software for his map, which takes a simple text file of options (e.g. “3 -> 4, 3-> 6) and compiles them into a diagram.
September 2008 My GMU students map CYOA books for a class on ergodic literature (ergodic: a neologism coined by Espen Aarseth to describe literature that requires non-trivial choices from the reader). The assignment is a revision of the September 2005 assignment, and I connect it to Franco Moretti’s idea of a “distant reading” of literature.
July 2009 Designer Michael Niggel creates an analysis of paths and outcomes of Journey Under the Sea (CYOA #2). Niggel finds that over 75 percent of the book’s endings are unfavorable (50 percent will actually end in death).
November 2009 Christian Swinehart offers multiple data views of twelve CYOA books, a project that took 13 months to complete. Swinehart’s project is in effect a longitudinal study of CYOA’s evolution, showing that later books were more linear and offered fewer endings.
Conclusions?
Given the recurring interest in these maps from both literature professors and computer scientists, I imagine we haven’t seen the last of these maps. I also imagine the trend to treat CYOA books as data sets will intensify. And as data sets, they can be manipulated in novel and ingenious ways, in which subtle patterns can be extracted, patterns which may tell us a great deal about what we humans like and don’t like in the stories we tell ourselves about ourselves.
[…] Update: Some CYOA context! Mark Sample provides a history of Choose Your Own Adventure viz. […]
@chooseadventure Indeed! I wrote a brief history about visualizations of CYOA books, including that one: http://t.co/IFz0EMsEgo
@Upstreamism Yes! I wrote a short history of CYOA visualizations a few years ago: http://t.co/IFz0EMsEgo
A History of Choose Your Own Adventure vis’s by @samplereality http://t.co/oKX5aG2SCn
A History of Choose Your Own Adventure Visualizations http://t.co/D1AEuIFVEp http://t.co/Ut1sHPmQ9D
A History of Choose Your Own Adventure Visualizations http://t.co/h0nRbta0eW via @samplereality
@aeleitch @mcclure111 this totally sounds cool. Is it any of the things linked to here? https://t.co/TfcIxNrPSl
@logodaedalus maybe this? https://t.co/MbPYuFxAFG (also first link there)
@FisherPriceTT @sternoPDX that’s awesome! if you could turn any earlier ones up, I’m sure @samplereality would love… https://t.co/Hv7SIeFbXz
Wow, @jeremydouglass’s work mapping game books show how far these techniques have come since I surveyed them in 200… https://t.co/kspnCOPu97